-
docker-compose로 ELK 8 버전 사용해보기 1부ELK 2023. 5. 3. 16:15
https://www.elastic.co/kr/downloads/elasticsearch
Download Elasticsearch
Download Elasticsearch or the complete Elastic Stack (formerly ELK stack) for free and start searching and analyzing in minutes with Elastic.
www.elastic.co
https://www.elastic.co/kr/downloads/kibana
Download Kibana Free | Get Started Now
Download Kibana or the complete Elastic Stack (formerly ELK stack) for free and start visualizing, analyzing, and exploring your data with Elastic in minutes.
www.elastic.co
https://www.elastic.co/kr/downloads/logstash
Download Logstash Free | Get Started Now
Download Logstash or the complete Elastic Stack (formerly ELK stack) for free and start collecting, searching, and analyzing your data with Elastic in minutes.
www.elastic.co
위의 사이트에 가서 최신버전(8.7.1)을 다운 받고 압축을 풀어준다.
이런 방법도 있지만, 삭제 후 재설치시 계정 관련 에러가 발생해서 docker-compose 로 하겠다.
https://github.com/deviantony/docker-elk
GitHub - deviantony/docker-elk: The Elastic stack (ELK) powered by Docker and Compose.
The Elastic stack (ELK) powered by Docker and Compose. - GitHub - deviantony/docker-elk: The Elastic stack (ELK) powered by Docker and Compose.
github.com
여기에 가서 해당 레포지토리를 git clone 해준다.
README를 읽으면 쉽게 설치 할 수 있지만 간단히 요약을 하자면,,
1. git clone 해주기
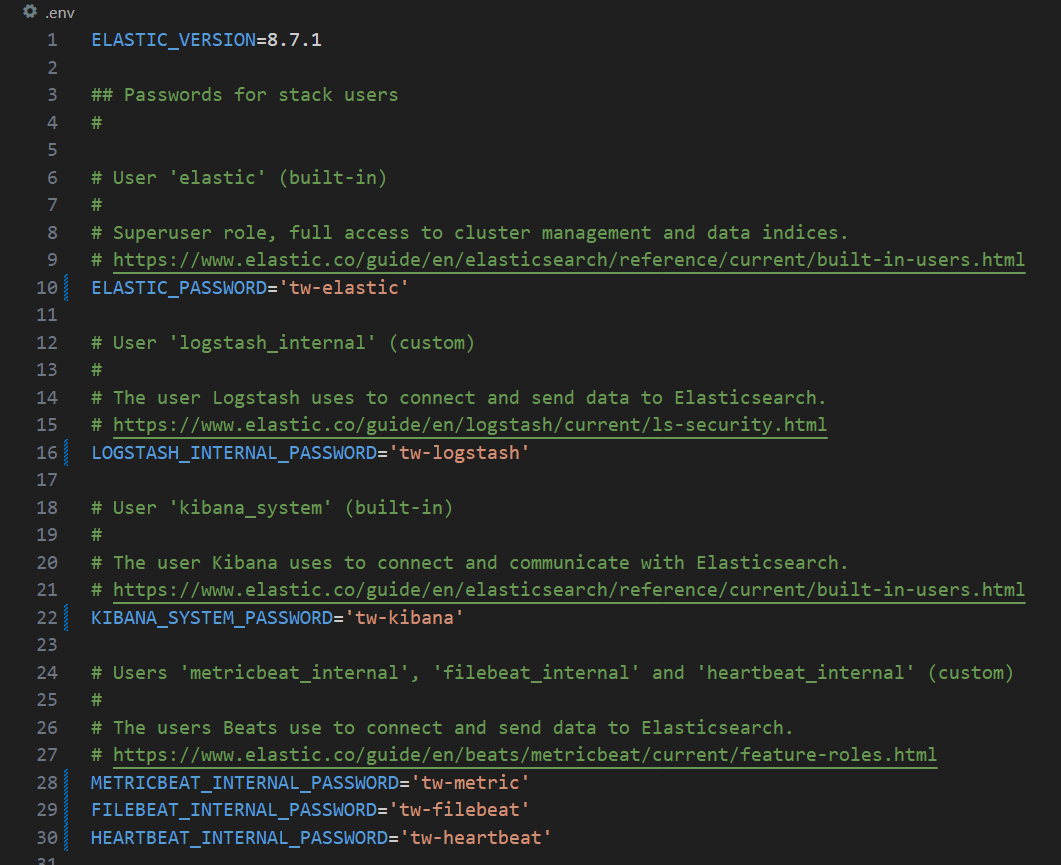
2. clone 해준 폴더에 들어가서 .env 파일의 값을 마음에 맞게 수정해주자.
3. 나는 elastic search, kibana, logstash를 사용할 것이므로, docker-compose 파일을 수정해야한다.

이렇게 하고 아래 명령어를 입력한다.
docker-compose up setup
docker-compose up -d
저는 윈도우에서 Docker Desktop 을 사용했습니다.
만약 리눅스 환경에서 실행하는 경우 profile을 unsupported하다고 하는 경우 docker-compose 를 업데이트 해야합니다.
[ubuntu, docker] docker-compose 업데이트
원문은 아래 블로그 https://sncap.tistory.com/1111 docker-compose 최신 버전으로 upgrade ㅁ Docker-compose upgrade $ apt install docker-compose or pip3 install docker-compose 시 설치 후 버전을 확인 하면 다음과 같다. $ docker-co
siane.tistory.com

아이디는 elstic 으로하고, 비밀번호는 elasticsearch에서 설정한 비밀번호로 하면 된다.

logstash는 작동하는지 어떻게 확인할까??
간단하게 input 파일을 하나 만들고, logstash를 사용해서 elastic search에 넣어보자.


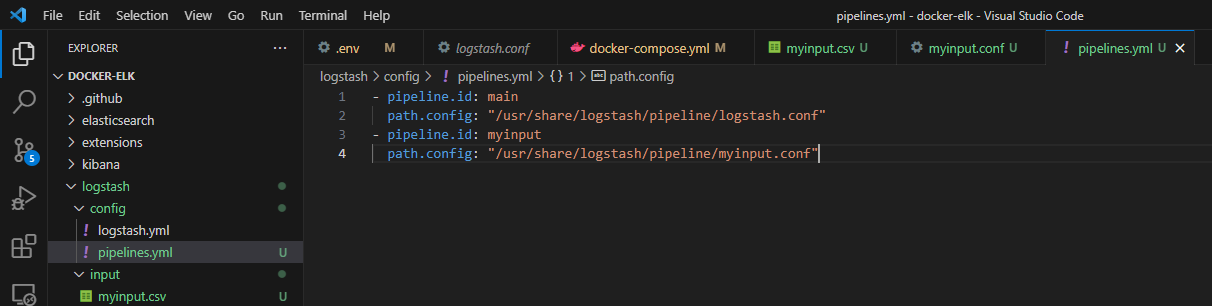
#./logstash/input/myinput.csv
aaaaa
bbbbb
ccccc
ddddd
eeeee
fffff
#./logstash/pipeilne/myinput.conf input { file { path => "/usr/share/logstash/input/myinput.csv" start_position => "beginning" } } filter { } output { elasticsearch { hosts => "elasticsearch:9200" user => "logstash_internal" password => "${LOGSTASH_INTERNAL_PASSWORD}" index => "myinput" } stdout { codec => rubydebug } }#./logstash/config/pipelines.yml - pipeline.id: main path.config: "/usr/share/logstash/pipeline/logstash.conf" - pipeline.id: myinput path.config: "/usr/share/logstash/pipeline/myinput.conf"이렇게 하고, docker-compose.yml에서 volume부분을 수정해준다.

      - ./logstash/config/pipelines.yml:/usr/share/logstash/config/pipelines.yml:ro,Z
      - ./logstash/input:/usr/share/logstash/input:ro,Z
이렇게하고 docker-compose down 으로 모두 ELK를 종료시켜준 다음, docker-compose up -d 로 다시 올려주자.
docker exec -it 로그스태시컨테이너ID /bin/bash위의 명령어로 컨테이너 내부에 들어가서 /config/pipelines.yml이 잘 적용되었는지 확인하고, /input 에 myinput.csv가 있는지 확인한다.
잘 있다면, docker logs 로그스태시컨테이너ID 로 로그를 확인하자.
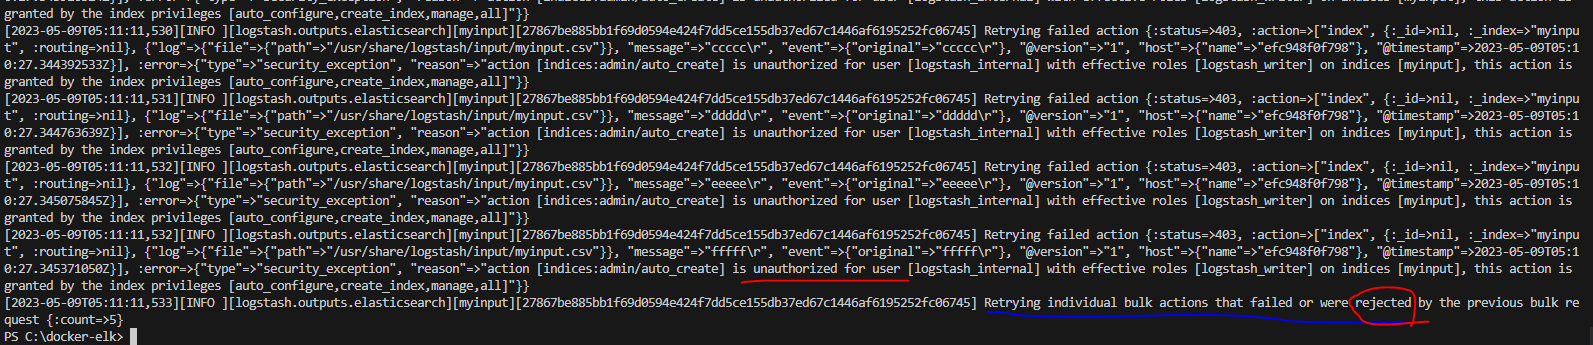
이렇게 에러가 발생한다.
키바나에 들어가보자.
아이디는 elastic이고, 비밀번호는 .env에 설정한 elasticsearch 비번을 입력하면 된다.


로그스태시는 logstash_internal user로 elasticsearch에 접근을 하는데 해당 유저는 role이 logstash_writer을 가지고 있다는 뜻이다.
logstash_writer에는 무엇이 있는지 확인해보자.


이렇게 있다. 에러메시지를 다시 봐보자.
[2023-05-09T05:17:23,950][INFO ][logstash.outputs.elasticsearch][myinput][27867be885bb1f69d0594e424f7dd5ce155db37ed67c1446af6195252fc06745] Retrying failed action {:status=>403, :action=>["index", {:_id=>nil, :_index=>"myinput", :routing=>nil}, {"@version"=>"1", "message"=>"ddddd\r", "log"=>{"file"=>{"path"=>"/usr/share/logstash/input/myinput.csv"}}, "@timestamp"=>2023-05-09T05:15:03.710532564Z, "host"=>{"name"=>"06832459f586"}, "event"=>{"original"=>"ddddd\r"}}], :error=>{"type"=>"security_exception", "reason"=>"action [indices:admin/auto_create] is unauthorized for user [logstash_internal] with effective roles [logstash_writer] on indices [myinput], this action is
granted by the index privileges [auto_configure,create_index,manage,all]"}}
핵심은 previlieges에 auto_configure, create_index, manage, all 이 있어야하고, test.conf에서 elasticsearch 의 myinput인덱스에 로그스태시를 사용해서 값을 넣어줄 꺼기 때문에 indices에 myinput을 적어주자.

이렇게 하고, 저장한다음, docker-compose down 으로 전부 꺼주고, 다시 docker-compose up -d 로 시작하자.
로그스태시 컨테이너 로그를 확인해보자.
{
       "message" => "aaaaa\r",
         "event" => {
        "original" => "aaaaa\r"
    },
           "log" => {
        "file" => {
            "path" => "/usr/share/logstash/input/myinput.csv"
        }
    },
          "host" => {
        "name" => "3dff6ad5cb1b"
    },
      "@version" => "1",
    "@timestamp" => 2023-05-09T05:26:37.230497667Z
}.....
이런식으로 나오면 성공이다.

이제 키바나를 사용해서 myinput 인덱스를 조회해보겠다.
우선 인덱스 전체조회를 해보자.
GET /_cat/indices?v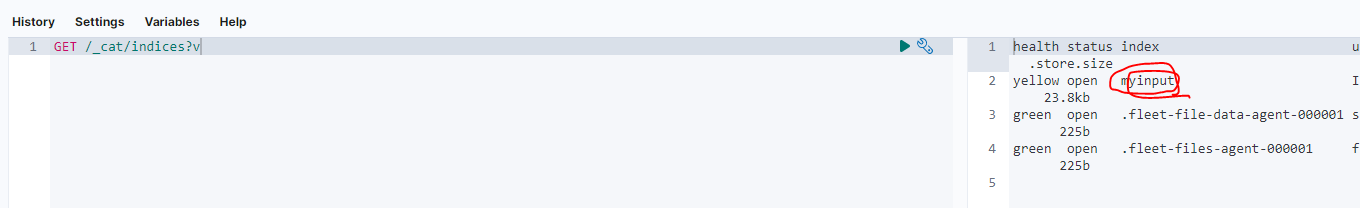
잘 나왔고, myinput 인덱스에 doc들은 무엇이 있는지 확인해보자.

전체 값들이 6개가 있다는 것을 확인함으로 실습을 끝내겠다.
추가로 myinput.csv에 값을 추가하면, 실시간으로 Elastic search에 반영됨을 볼 수 있다.
다음은 로컬에서 ELK에 인증서를 적용해보겠다.
docker-compose로 ELK 8 버전 사용해보기 2부(https)
https://xodns.tistory.com/115 ELK 8 버전 사용해보기 1부 https://www.elastic.co/kr/downloads/elasticsearch Download Elasticsearch Download Elasticsearch or the complete Elastic Stack (formerly ELK stack) for free and start searching and analyzing in
xodns.tistory.com
'ELK' 카테고리의 다른 글
docker-compose로 ELK 8 버전 사용해보기 2부(https) (0) 2023.05.09